7 Essential Best Chart for React Tools to Use

7 Essential Best Chart for React Tools to Use
Suraj Vishwakarma
Updated
Originally Published
Navigation Map
- Introduction
- Why Choosing the Right React Charting Tool Matters in 2025
- The Evolving Landscape of Data Visualization in React
- Impact on Developer Productivity and App Performance
- Key Criteria for Evaluating React Chart Libraries
- Common Challenges and Pitfalls to Avoid
- 7 Essential React Chart Tools to Use in 2025
- Recharts
- Victory
- Nivo
- React-Vis
- Chart.js + React Wrapper (react-chartjs-2)
- ECharts for React (echarts-for-react)
- Visx
- How to Select the Best React Chart Library for Your Project
- Assessing Project Requirements and Team Skills
- Performance, Accessibility, and Maintenance Considerations
- Integration with Existing Tech Stack
- Future-Proofing Your Choice
- Tips and Best Practices for Implementing Charts in React
- Optimizing Chart Performance in React Apps
- Ensuring Accessibility and Responsiveness
- Customizing and Theming Charts
- Testing and Debugging Chart Components
Introduction
Data-driven applications are growing rapidly, and React projects in 2025 demand modern, interactive charting solutions. User expectations for visualizations keep rising, with performance and developer efficiency now more important than ever.
Choosing the right chart library for React isn’t just about aesthetics—it can truly transform the user experience, boost performance, and streamline your development workflow.
In this article, you’ll discover 7 essential, best-in-class React chart libraries and tools tailored for 2025 projects. We’ll guide you to make informed choices for your unique needs.
Explore each tool’s standout features, pricing, pros and cons, and learn which is ideal for your use case.
Get ready to elevate your project with the right charting solution for React.
Why Choosing the Right React Charting Tool Matters in 2025
Selecting the best chart library for React projects is a foundational step for any modern web application in 2025. The right choice can unlock new levels of user engagement, performance, and developer efficiency. Let's explore why your charting library matters more than ever.
The Evolving Landscape of Data Visualization in React
In 2025, the drive for real-time, interactive, and visually stunning data charts is stronger than ever. Applications now process massive, complex datasets and demand seamless analytics. Users expect personalization, dynamic filtering, and clear insights from every dashboard.
Accessibility and customization are no longer optional. Developers must ensure charts are usable by everyone, including those relying on screen readers or keyboard navigation. Mobile responsiveness is also essential, as more users access dashboards on various devices.
Choosing the best chart library for React is about staying ahead of these trends. It means ensuring your visuals are not just attractive but also functional and inclusive.
Impact on Developer Productivity and App Performance
The right charting tool can dramatically reduce development time and technical debt. A well-designed library offers reusable components, efficient rendering, and intuitive APIs. This streamlines the process, allowing your team to focus on business logic instead of chart mechanics.
Performance is a critical factor. Bundle size, rendering speed, and memory usage directly affect user experience. According to recent benchmarks, some libraries handle large datasets more gracefully than others.
Developer surveys highlight that chart library adoption is often influenced by performance and ease of use. Projects with high data throughput gain the most from optimized tools.
Key Criteria for Evaluating React Chart Libraries
When searching for the best chart library for React, start with a checklist of essential features. Look for a rich variety of chart types, interactive capabilities, customization options, thorough documentation, and robust TypeScript support.
Integration is another key factor. Ensure the library works smoothly with your React framework, whether you use Next.js, Remix, or another stack. Consider licensing, community support, and the likelihood of long-term maintenance.
A quick comparison table can help:
| Criteria | Why It Matters |
|---|---|
| Chart Types | Supports all needed visualizations |
| Interactivity | Engages users with real-time data |
| Customization | Matches brand and design needs |
| Documentation | Eases onboarding for developers |
| TypeScript Support | Ensures type safety |
Common Challenges and Pitfalls to Avoid
Choosing the wrong charting tool can lead to major setbacks. Poor documentation, infrequent updates, and lack of extensibility often result in wasted time and mounting technical debt.
There are cases where teams have picked a library that was not actively maintained. Months later, they faced compatibility issues and had to refactor the entire charting layer. To avoid this, always assess library health: check GitHub activity, review open issues, and scan for recent releases.
When evaluating libraries, remember to test for flexibility and future-proofing. A healthy open-source project will have regular contributions, active community discussions, and clear documentation for both basic and advanced use cases.
7 Essential React Chart Tools to Use in 2025
Navigating the landscape of React chart libraries in 2025 is no small feat. With so many options available, identifying the right tool can dramatically shape your app’s success. Each library brings unique features, performance profiles, and design philosophies, making it crucial to match the right tool to your needs.
In this section, we’ll break down seven leading libraries, exploring their capabilities, pricing, strengths, drawbacks, and ideal use cases. If you want to explore a different perspective or compare these options further, check out the 4 Best Charting Libraries for React for a complementary review.
Below, you’ll find a detailed look at each contender for the best charting library for React in 2025.
Recharts
Recharts stands out as a top choice for developers seeking simplicity and flexibility. This open-source library operates under the MIT License, making it accessible for teams of all sizes.
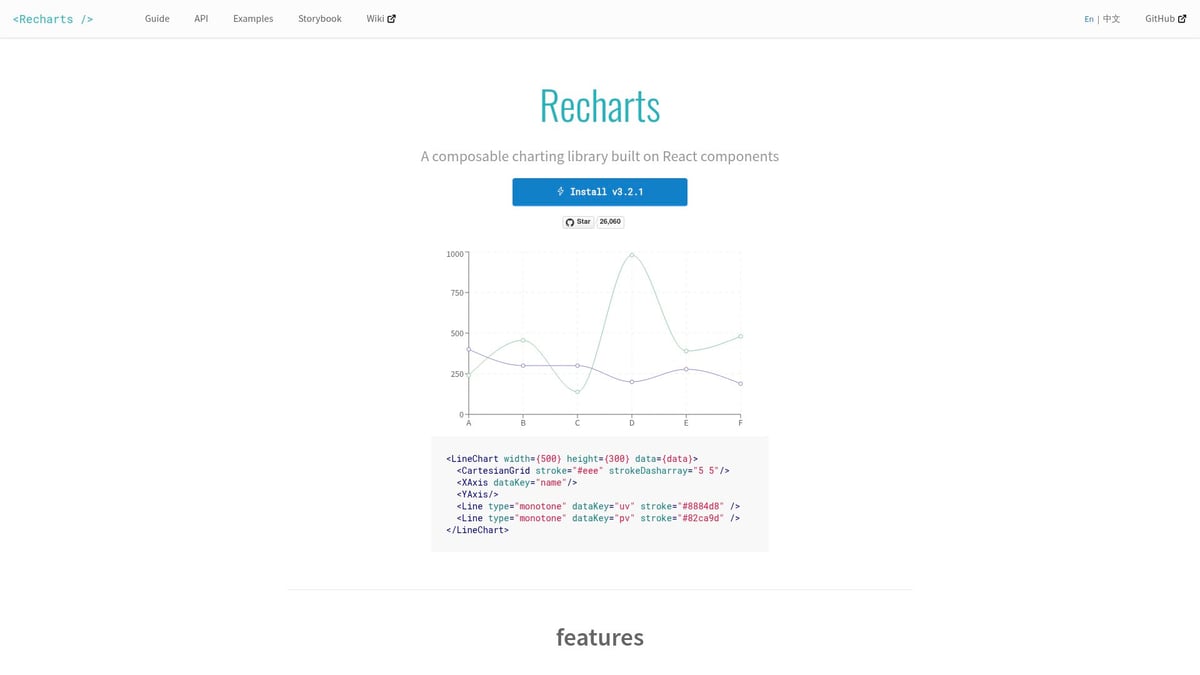
Core Features:
- Declarative React components
- Responsive design out of the box
- A broad selection of chart types, including line, bar, area, pie, and radar
- Composable architecture for nesting and combining charts
Recharts excels with its React-first API, prioritizing ease of integration and customization. Developers can quickly create stunning dashboards or analytics tools, making it one of the best solutions for startups and internal apps.
Pros:
- Lightweight and fast for most use cases
- Well-maintained documentation
- Active community support
Cons:
- Lacks some advanced or exotic chart types
- Not optimized for extremely large datasets
Example use case: Many startups rely on Recharts for internal dashboards where rapid prototyping and customization are essential.
With its balance of power and simplicity, Recharts continues to be a top contender for React projects in 2025.
Victory
Victory is another leading candidate when evaluating chart libraries. It is open-source and licensed under MIT, catering to teams that prioritize modularity and cross-platform compatibility.
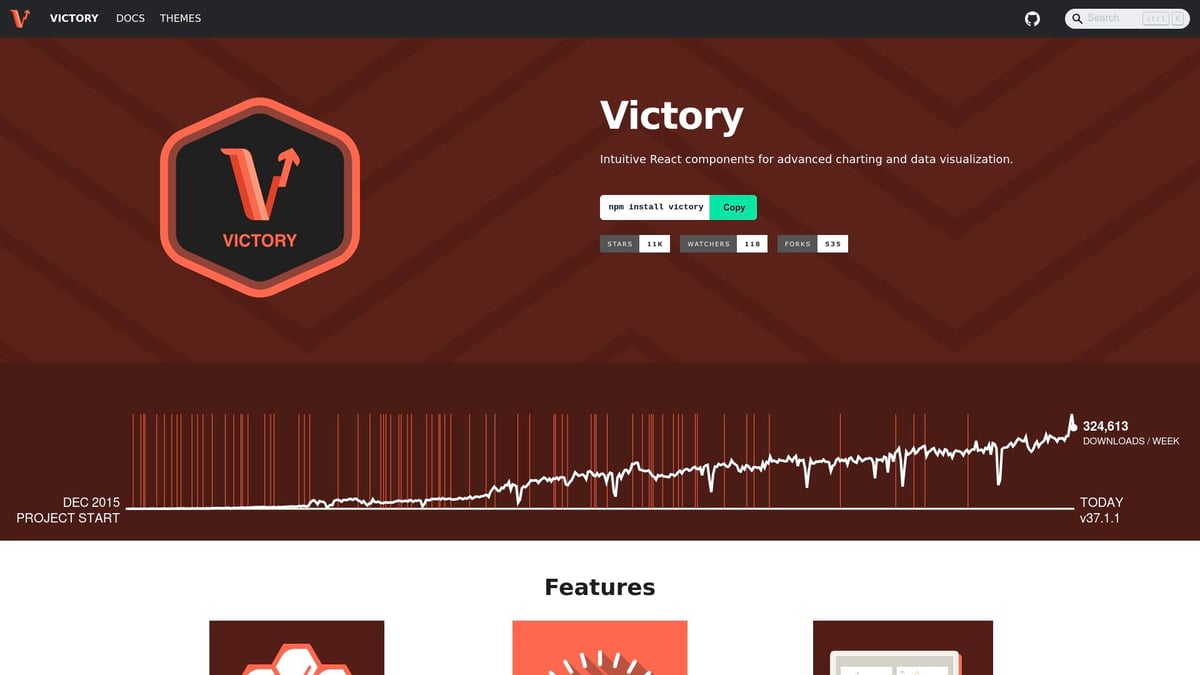
Core Features:
- Modular charting components for both web and React Native
- Animation and theme support
- Strong accessibility features
- Consistent API for web/mobile
Victory’s modular approach lets developers assemble highly customized charting experiences, which is key for scenarios requiring both flexibility and accessibility.
Pros:
- High customizability
- Excellent documentation and learning resources
- Active development and broad community support
Cons:
- Slightly steeper learning curve compared to basic libraries
- May experience performance drops with very large datasets
Example use case: Educational and healthcare platforms often choose Victory for its accessibility features and cross-platform consistency.
Victory’s robust feature set cements its place among the best solutions, especially for teams needing advanced customization.
Nivo
Nivo has quickly risen as a go-to option, thanks to its visually impressive charts and comprehensive feature set. Nivo is open-source for most use cases, with commercial licenses available for expanded support.
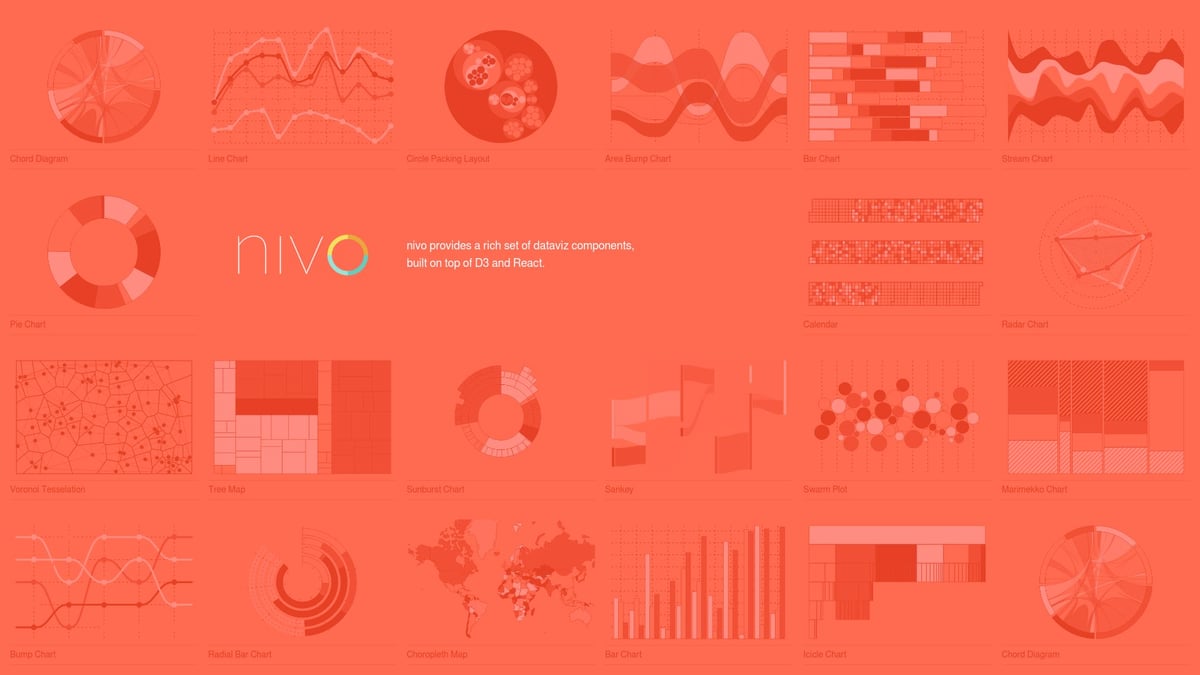
Core Features:
- Supports a wide variety of chart types, including heatmaps, treemaps, and calendars
- Multiple rendering engines: SVG, Canvas, and WebGL
- Extensive theming and motion/animation capabilities
- Server-side rendering support
Nivo is tailored for data-intensive applications where visual impact is as important as functionality, especially when unique or advanced chart types are required.
Pros:
- Modern, visually stunning design
- Highly customizable with a robust API
- Active community and thorough documentation
Cons:
- Larger bundle size compared to minimal libraries
- Some advanced chart types require deeper configuration
Example use case: Fintech and marketing dashboards that need advanced, branded visualizations often leverage Nivo for its customization options.
Nivo is a strong candidate for users demanding diverse, high-impact visualizations.
React-Vis
React-Vis, developed by Uber, remains a practical choice for those looking for a simple charting solution. This MIT-licensed library offers a straightforward API and a reliable set of standard charts.
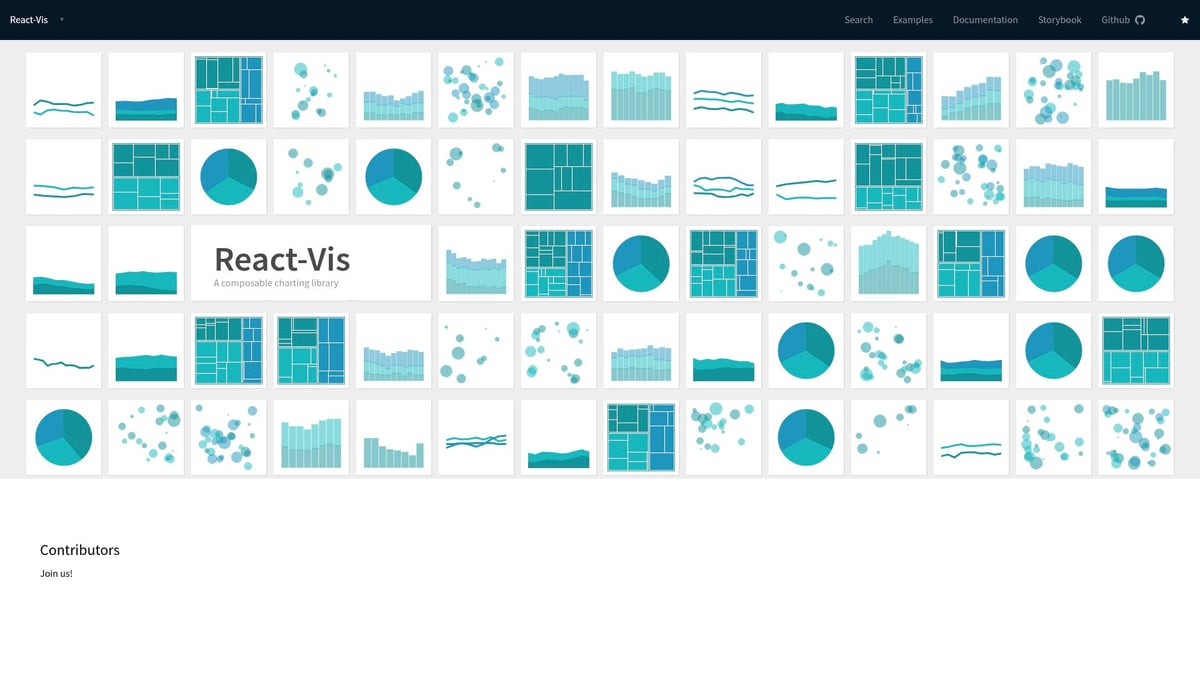
Core Features:
- Basic chart types like line, bar, scatter, and area
- Built-in tooltips and legends
- Animation support for standard charts
- Minimal configuration needed
React-Vis is ideal for rapid prototyping or MVPs, where getting a chart up and running is more important than advanced features, especially in internal tools.
Pros:
- Very low learning curve
- Quick implementation
- Reliable for standard visualizations
Cons:
- Not actively maintained as of 2025
- Lacks advanced features and extensibility
- Not recommended for production-scale or complex apps
Example use case: Uber has used React-Vis for internal data dashboards where speed and simplicity take precedence over extensibility.
React-Vis is a straightforward solution for developers who want a chart with minimal overhead.
Chart.js + React Wrapper (react-chartjs-2)
The combination of Chart.js and its React wrapper, react-chartjs-2, is a classic option for those seeking a mature ecosystem. Chart.js is open-source under the MIT License.
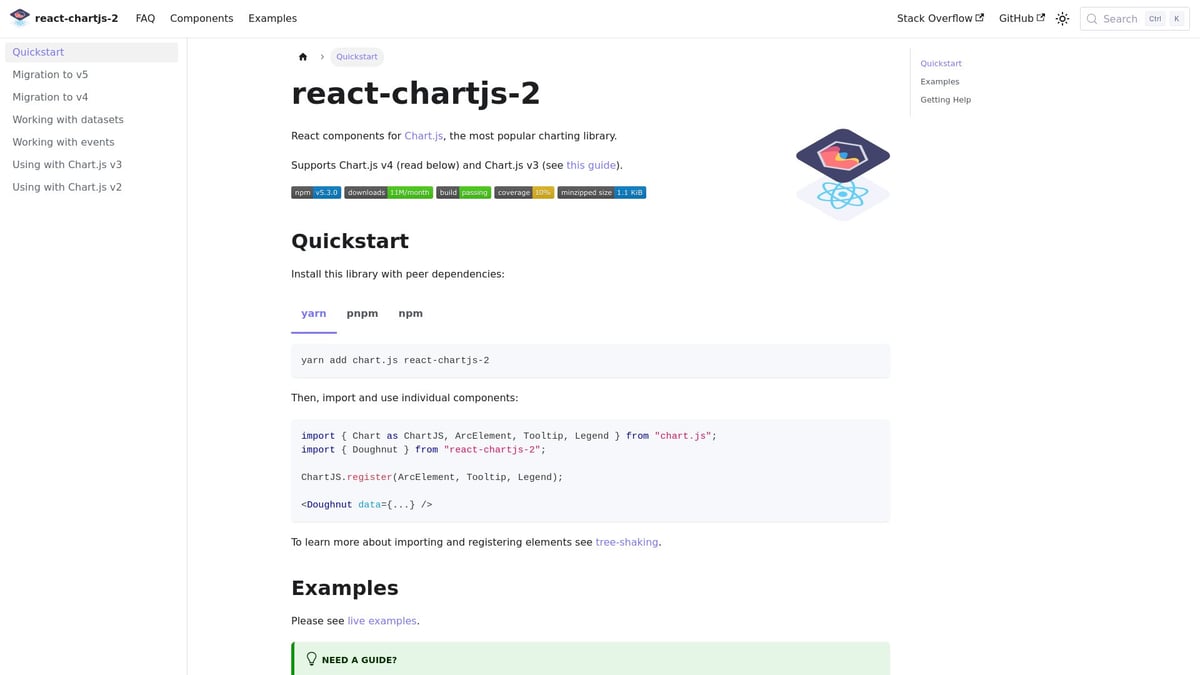
Core Features:
- 8+ chart types including bar, line, doughnut, radar, and more
- Robust plugin architecture for extending functionality
- Responsive design and touch support
- Integration with React via the react-chartjs-2 wrapper
This pairing is a great fit for projects needing stability and a large user community, especially for those looking for time-tested reliability.
Pros:
- Mature, stable codebase
- Extensive third-party resources and plugins
- Responsive and accessible by default
Cons:
- Advanced interactivity requires plugins, which can add complexity
- Customization beyond default options may require extra effort
Example use case: E-commerce analytics and academic dashboards regularly use Chart.js with react-chartjs-2 for classic charting needs.
For many, this combination remains a staple in their toolkit.
ECharts for React (echarts-for-react)
ECharts for React is a robust, enterprise-grade solution for teams with advanced visualization needs. ECharts is open-source under the Apache 2.0 License.
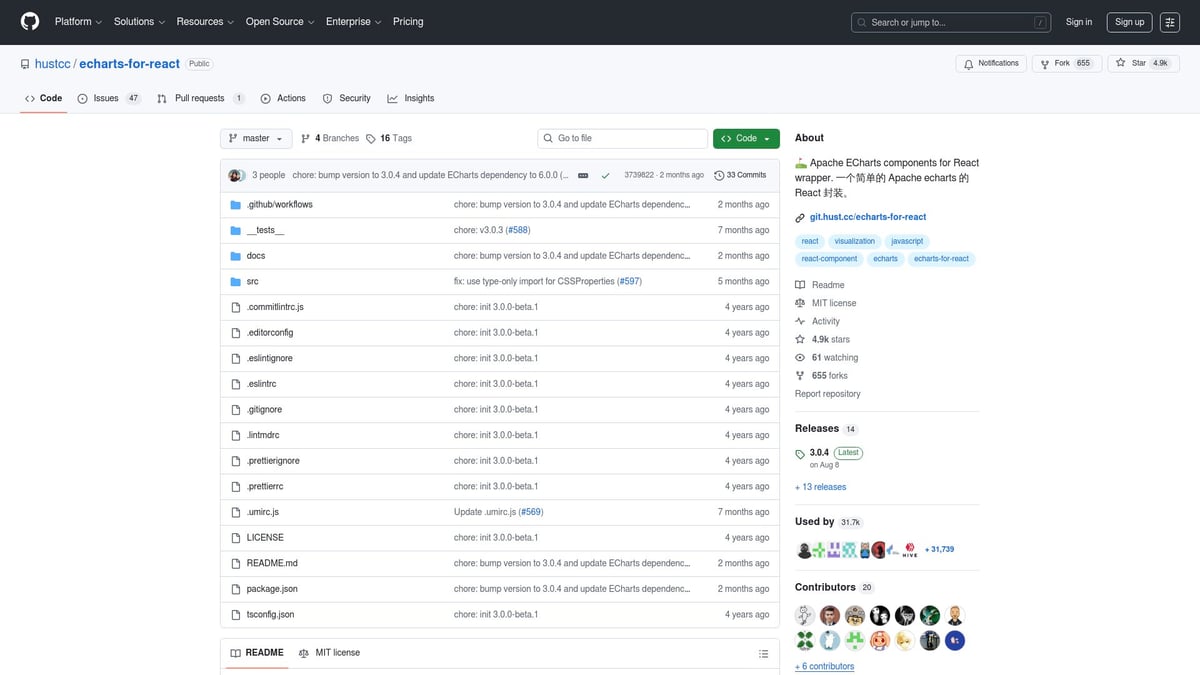
Core Features:
- 40+ chart types, including maps and network diagrams
- High-performance rendering (SVG/Canvas)
- Supports massive datasets without lag
- Internationalization and global usage
ECharts for React is perfect for enterprises and large-scale dashboards where flexibility and performance are critical, especially in complex, data-rich environments.
Pros:
- Extremely flexible and powerful
- Handles large and complex datasets efficiently
- Strong international community and support
Cons:
- API is more verbose than some competitors
- Documentation may be challenging for beginners
Example use case: Major enterprises like Alibaba and Baidu use ECharts for React in their portals and analytics suites.
For large projects demanding versatility, ECharts is often the best choice.
Visx
Visx, created by Airbnb, is a unique entry for developers who want full control and customization. It is open-source under the MIT License.
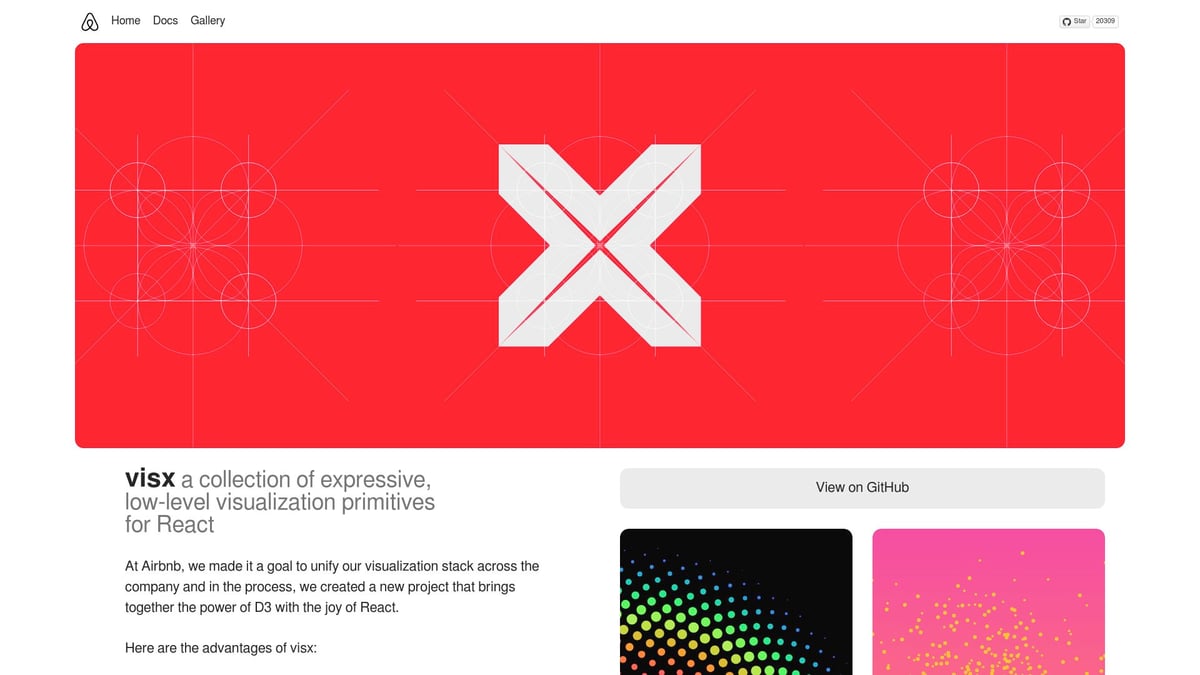
Core Features:
- Low-level visualization primitives for building bespoke charts
- Seamless D3 integration for advanced rendering
- Highly customizable and composable architecture
- Efficient SVG rendering for performance
Visx is designed for advanced developers who want to craft tailored visualizations. When granular control is a top priority, Visx is often the best choice for custom solutions.
Pros:
- Minimal overhead, no unnecessary abstraction
- Integrates smoothly with existing React codebases
- Enables highly customized, branded dashboards
Cons:
- Steep learning curve, requires D3 knowledge
- More setup and boilerplate compared to high-level libraries
Example use case: Airbnb relies on Visx for custom analytics tools where off-the-shelf solutions fall short.
If you need a foundation for building charts from scratch, Visx is a premier choice.
How to Select the Best React Chart Library for Your Project
Choosing the right chart library starts with a clear understanding of your unique project landscape. Every React application has different charting needs, and making the right choice affects not only the visual appeal but also the maintainability and scalability of your codebase.
Assessing Project Requirements and Team Skills
Start by mapping your team’s skills and the specific needs of your application. The best choice will strike a balance between capability and usability for your developers.
Ask yourself:
- What chart types do you need (bar, line, heatmap, etc.)?
- How large is your dataset, and will you need real-time updates?
- Do you require mobile or cross-platform support?
- How complex is your data, and what level of customization will be necessary?
Use a checklist to align your requirements:
| Requirement | Must-Have | Nice-to-Have |
|---|---|---|
| Specific Chart Types | ✔ | ✔ |
| Real-Time Support | ✔ | |
| Mobile Friendly | ✔ | |
| High Customization | ✔ |
By clarifying these points early, you ensure you select a library that matches your technical stack and your team’s expertise.
Performance, Accessibility, and Maintenance Considerations
Performance is non-negotiable when working with modern React apps. The best charting libraries offer efficient rendering, minimal bundle size, and accessible features out of the box.
Look for libraries with:
- Fast initial load and update times
- Support for ARIA attributes and keyboard navigation
- Ongoing maintenance and community engagement
Prioritize libraries that receive regular updates and have active contributors, as this directly impacts long-term reliability.
Integration with Existing Tech Stack
Seamless integration is vital. Your chosen library should fit naturally into your current frameworks, such as Next.js, Gatsby, or Remix. Compatibility with TypeScript and state management libraries like Redux or Zustand is equally important.
Consider creating a quick compatibility table:
| Library | Next.js | TypeScript | SSR | Redux |
|---|---|---|---|---|
| Recharts | ✔ | ✔ | ✔ | ✔ |
| Victory | ✔ | ✔ | ✔ | ✔ |
| Nivo | ✔ | ✔ | ✔ | ✔ |
For example, both Nivo and Victory are known for smooth server-side rendering support, making them ideal for SEO-focused or statically generated sites. Always ensure the library integrates without friction, saving you debugging time and future headaches.
Future-Proofing Your Choice
Think long-term when selecting a library. A future-proof library is actively maintained, has strong documentation, and shows steady growth in community adoption.
Key indicators include:
- Frequent releases and bug fixes
- A healthy number of contributors and resolved issues
- Up-to-date documentation and migration guides
Leverage tools like GitHub stars, npm download trends, and open issue counts to assess project health. By prioritizing sustainability, you ensure your choice remains robust as your project evolves.
Tips and Best Practices for Implementing Charts in React
Implementing charts in your application requires more than just picking a library. It involves optimizing for speed, accessibility, theming, and robust testing. Let’s break down the essential best practices for 2025.
Optimizing Chart Performance in React Apps
Performance is critical, especially for dashboards and real-time analytics. Large datasets and complex visuals can slow down your app if not handled well.
- Use lazy loading to defer chart rendering until the component is visible.
- Apply memoization (
React.memo,useMemo) to prevent unnecessary re-renders. - Implement virtualization for lists or charts with many data points.
- Profile chart components to detect bottlenecks.
For more advanced performance strategies specific to React, check out Optimizing React Applications for Maximum Performance. By following these steps, your charts will remain smooth and responsive as your data grows.
Ensuring Accessibility and Responsiveness
Modern users expect charts to be accessible and mobile-friendly. A chart should be navigable by keyboard and screen readers, and adapt to different devices.
- Add ARIA labels and roles to chart containers.
- Provide alternative text for chart images or SVGs.
- Ensure keyboard navigation for interactive chart elements.
- Use responsive layouts and flexible containers for mobile support.
Victory, for example, includes built-in accessibility features, making it a strong choice for inclusive applications. Remember, accessible charts improve usability for everyone.
Customizing and Theming Charts
Brand consistency and user engagement often rely on how well you can theme and customize your charts. Most top libraries offer theming APIs and support popular styling approaches.
- Leverage built-in theming systems or CSS-in-JS for advanced styles.
- Use custom renderers to tailor tooltips, legends, and axes.
- Integrate with popular UI component libraries, many of which are cataloged in 8 Popular React UI Component Libraries.
By aligning your charts with your brand’s aesthetic, you enhance user trust and app cohesion.
Testing and Debugging Chart Components
Testing is essential to guarantee the reliability of your charts in production. Visualizations can be sensitive to data changes, so robust testing prevents regressions.
- Use snapshot testing to capture chart output over time.
- Apply visual regression tools like Chromatic to catch subtle UI shifts.
- Integrate Storybook for interactive component exploration.
- Employ end-to-end testing with Cypress for user flows.
Combining these strategies ensures your charts remain accurate, stable, and visually consistent as your codebase evolves.